|
Throughout L2, our class worked on the replicability of experiences with the AJA project. Redoing someone’s protocol and analyzing the obtained results helped us see the importance of being able to replicate an experience both to verify a method and to verify conclusions. To be able to accurately replicate an experience, a detailed protocol is needed. To maintain traceability of experiments in a lab, you are required to keep an updated lab notebook that stays within the team. Why is it important to keep a good lab notebook? First of all, keeping an updated and clean lab notebook is important for you. It helps you move forward productively in your experiments, to make sure you don’t redo the same experiment or reproduce the same mistakes. It can also help you explain your results or justify changes in methodology for example. Secondly, your lab notebook will be used by others after you leave the lab. This detailed trace of your work helps others save time both in understanding what has been done before and why it was done. What is a good lab notebook (according to me)? Objective: why you are doing this experiment, Protocol: detailed protocol with specific material used, with added comments of things that changed, any things you noticed during the experiment, Results: detailed results with labelled figures, highlight anything you find interesting Conclusions: what you can conclude from this experiment, and the next steps based on this Why do I care?
I based the beginning of my work a lot on the work of previous interns, so when details were missing, it was complicated to proceed. I needed to know what primers had been used, and a specific trace of exactly what sequence was used was not always present. Also, choices linked to primer pairs were not always justified. One experiment was done with several different options and directly after only one pair was used, so I had to redo this experiment in order to understand if there was a problem in efficiency. What can seem really clear in your head might not be for someone else, so writing down all the details in your lab notebook is really important!
1 Comment
My internship has been composed of two main parts : a laboratory part and a bioinformatic analysis part! During my lab work, I started with a small marine macroalgae sample and obtained in the end a DNA sequence. The techniques I used are widely used for molecular analysis in biotechnology: DNA extraction, DNA amplification by PCR and finally DNA sequencing by the Sanger Method. DNA extraction DNA is extracted from the algae cell's nuclei, there is just one multi-nucleic cell, by using physical force as well as chemical compounds to degrade the cell wall. I used a ball mill to physically tear up the algae cell's tissue. By putting a little stainless steel ball inside the microtube with my tissue sample and then shaking the tube at a high frequency, what is left in the tube no longer looks like a little algae, but is rather a greyish green powder. We then add a lysis buffer composed of CTAB and Proteinase K to chemically degrade the tissue. A four hour lysis, during which the sample is heated at 60°C and agitated at 800 rpm, also uses a physical force, heat, to degrade the cell walls. Finally, this solution is purified thanks to a mix of chloroform and isoamyl alcohol which separates the DNA from the protein and lipid compounds. DNA amplification We then dose the DNA solution using a NanoDrop, corresponding to a small spectrometer, to know how much DNA was extracted from the cell. The DNA we obtained is then amplified by Polymerase Chain Reaction (PCR) on certain regions of interest, the tufA and rbcL markers. For a quick recap about PCR you can check out this very clear video. We therefore used existing primers to amplify these sequences of interest and visualized results by electrophoresis. If the results were not satisfactory, meaning that we had a double mark or no mark at all, we modified the DNA solution's concentration or the PCR program. Sanger Sequencing Once we have obtained a highly concentrated DNA solution with only the fragment we are interested in sequencing, we can purify the solution using a Sephadex column. The solution is then ready to be sequenced, starting with the sequence reaction using only one primer. Sanger sequencing is resumed here. Since sequencing is automated by a machine, the only part where I manipulated was during the sequencing reaction. I have therefore obtained a chromatogram with my sequence, now on to the bioinformatics part ! On my computer, more magic happens! Sequence analysis Once I have obtained my chromatogram, I correct certain ambiguities thanks to the Geneious program. Like Margaux had shown in her previous post, sometimes nucleotide peaks can be overlapping and in that case, the analyst has to decide whether one is more prominent or whether it remains inconclusive. The sequences also need to be trimmed (most commonly at the beginning and at the end) to keep only our region of interest as well as only the legible part of the sequence. Once the sequences are clean, I can align them all using the muscle alignment method. I then use this alignment to create several different kinds of phylogenetic trees following the Maximum Likelihood reconstruction method as well as the Neighbor Joining method. I compare these results and analyze two things : what species clade my samples correspond to and if they are genetically close to other samples from the Indian Ocean or not. This helps me see both the number of different species that were found during the sample collection as well as validate or invalidate existing patterns and hypotheses of speciation. Here is a little recap in visual form : 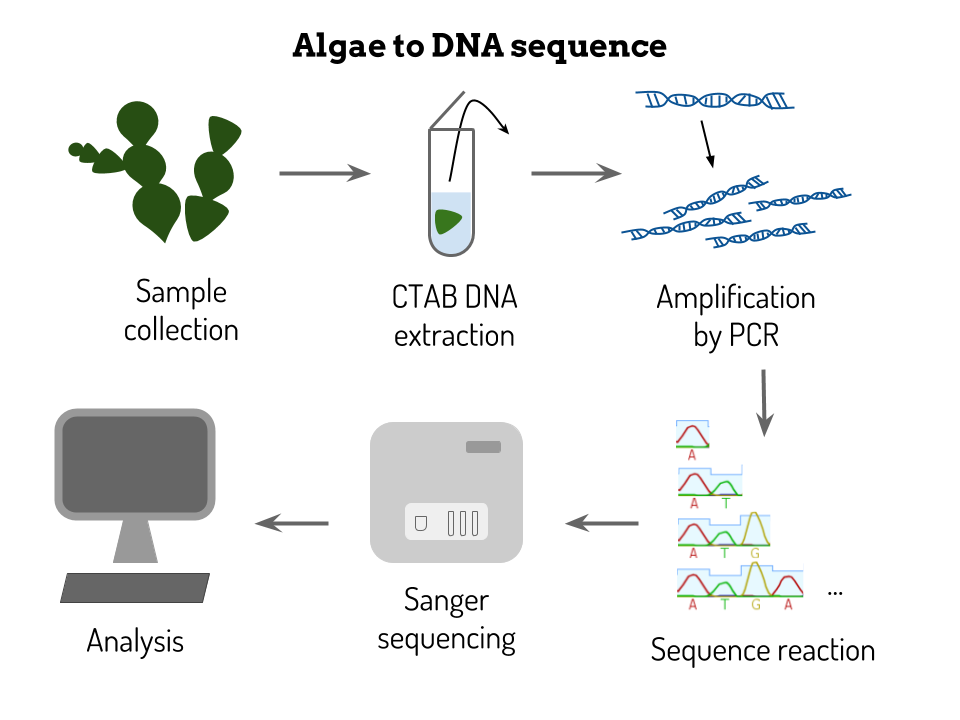 You'll hear more about my results soon !
Don't hesitate to ask any questions you might have! Quantifying algal diversity and elucidating their biogeographical affinities are the two goals of my internship. I focus mainly on the genre Halimeda of the Bryopsidales order which contributes to primary production and carbonate structure of tropical coral reef ecosystems. Morphological identification of individuals has often overlooked cryptic species, so two chloroplastic molecular markers are used to differentiate species. Considering heightened environmental impacts in Madagascar, it is paramount to correctly estimate the number of different species and their ecological ranges, hopefully leading to stronger conservation efforts. 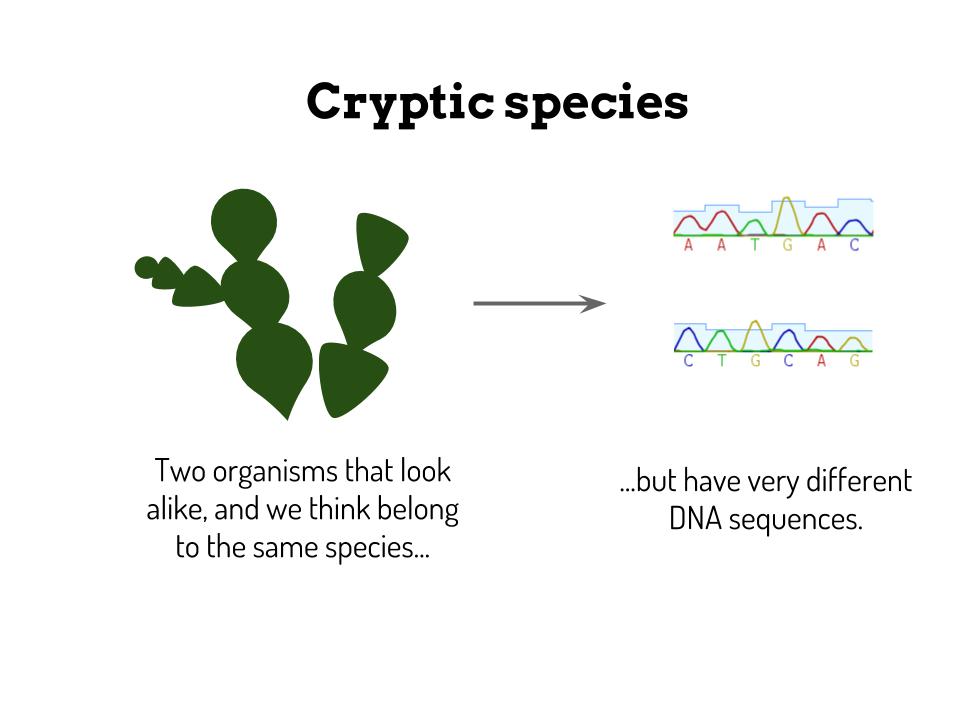 One of the amazing opportunities I have had while I have been here is to do field work with Alexia Dubuc who is doing her PhD between James Cook University in Australia and the IRD New Caledonia on the effect of water quality in mangrove forests on fish populations. Mangrove forests have huge ecological significance, they store 3 to 5% more carbon per unit area than any other forest system, protect coasts from erosion and are nurseries for many different species of coral reef fish. A mangrove forest is a marine marsh ecosystem composed of trees with large roots growing in sea water on tropical coastlines and river deltas. (1) You can see one below and learn more about this impressive ecosystem by following the links in the sources section of this post. 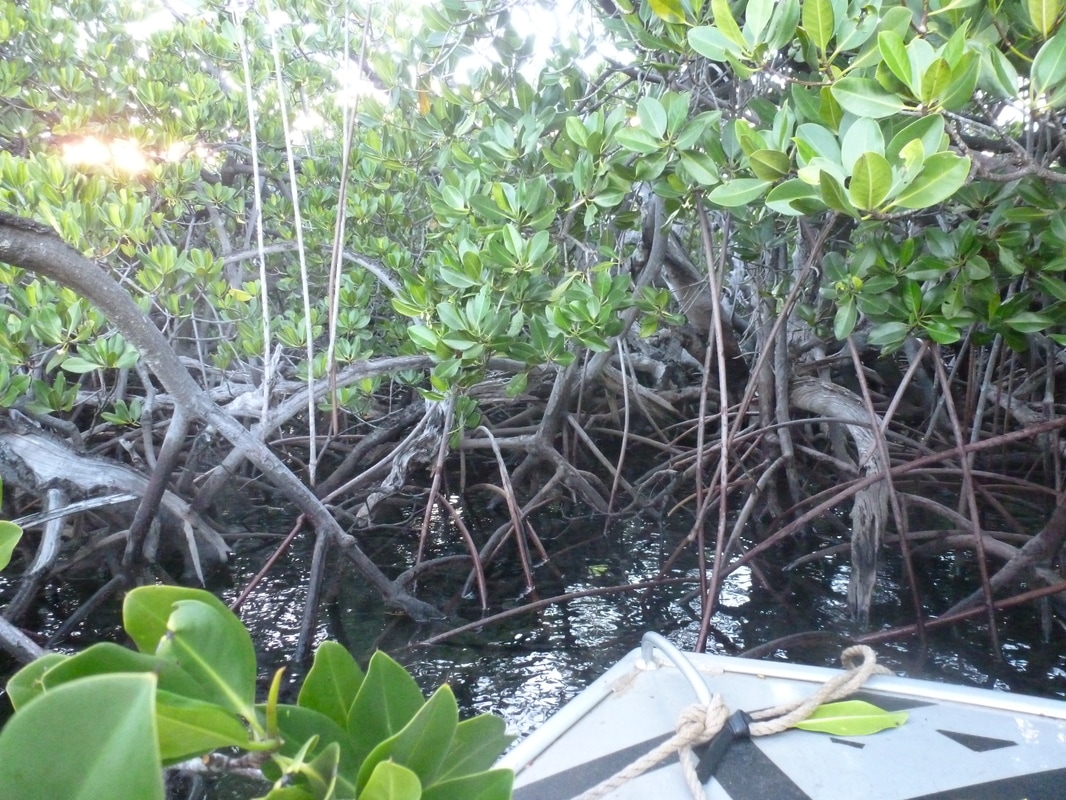 Mangrove forest in Bouraké, trees from Rhizopora family, front of our boat. Research topic Fish, and especially juvenile individuals, depend on the oxygen produced by benthic diatoms, the microalgae that reside in mangrove forests. This oxygen production depends on sunlight exposure, temperature, sediment deposit and finally tides. Experts have noticed that most fish stay on the exterior limits of the mangrove but why is this? Are physical forces like water current or obscurity to blame or are chemical properties of the water, such as salinity, oxygen content, ammonium concentration or pH at stake? Alexia chose to explore the oxygen parameter, since very little literature exists on this topic, and to examine if there is a correlation with fish presence and abundance. Methodology We therefore placed waterproof cameras within the mangrove forest (at least one meter from the edge of the roots) and at the edge of the forest, each on a weighted base with a 50 cm long pole used for scale, composing one transect. We also placed an oxygen sensor along with a depth gauge near the cameras, this reminded me of the Biosensors! We set up this system for four transects and one isolated site within the Bouraké mangrove. Measurements were made at rising tide and receding tide on the same day two days in a row for one weak tide as well as strong tide, often separated by a week, and repeated in summer and winter seasons. There are therefore many replicates to take into account or dissociate different effects, and to have statistic significance. The collected videos are then analyzed by establishing the different fish species that are present, their approximate age based on size, and the maximum number visible at the same time. We can’t actually say how many fish were present in the mangrove forest since we can’t determine whether the same fish passed in front of the camera or whether it was another fish. Perspectives Alexia’s PhD tackles another aspect of mangroves, human impact. In fact, mangroves are often used for wood collection by local populations or as an ideal place for small or large-scale fisheries. I am therefore doing field work with her in two different locations: Bouraké, composed of trees of the Rhizophora family of which the roots grow very near coral formations, and Port Ouenghi, situated near a fishery. The sedimentary deposit and obscurity in the mangrove are different, leading to different oxygen production rates. Water quality might also be different accounting for the waste water from the fishery. During our field work, I noticed a brown coat forming at the water surface during low tide, which you can see on the right side of the picture underneath. I think this could also participate in lowering oxygen levels within the mangrove and therefore slowing fish activity at this time, and I will try to collect some samples during my field work next week to see what it is composed of. Sources:
(1): WWF, 2015, http://www.worldwildlife.org/stories/communities-come-together-to-restore-mangroves (2): Conservatoire du Littoral, Nouvelle Calédonie, 2016. http://www.oeil.nc/fr/natural-environment/la-mangrove (3):IRDNouvelleCalédoniehttps://nouvelle-caledonie.ird.fr/recherche-et-missions/unites-de-recherche/mineralogie-et-physique-des-milieux-condenses/la-mangrove-caledonienne-un-ecosysteme-remarquable-mais-menace Hi everyone! I hope you are all enjoying your second semester! A week ago, I started my internship at the Institute of Research for Development (IRD), which aims to contribute to social, economic and cultural development in less developed countries through interdisciplinary research projects. I am working in the mixed research unit (UMR) ENTROPIE which studies marine and tropical ecology of the Pacific and Indian oceans and is based in Nouméa, New Caledonia. In case you are not familiar with where “le caillou” (the rock in french) is: 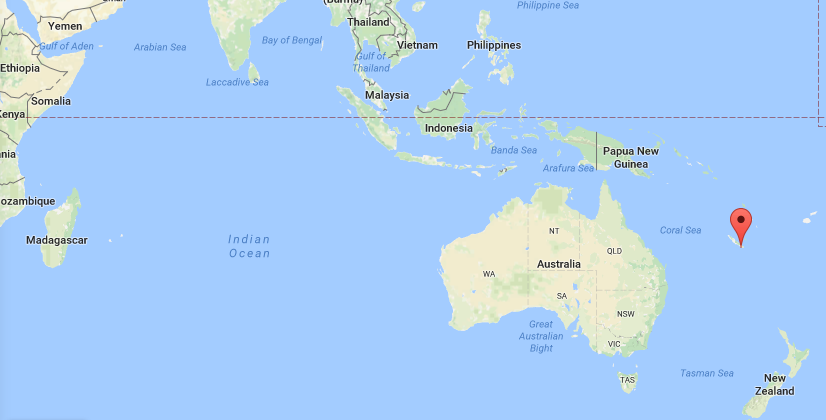 My project focuses on molecular phylogeny of green macroalgae samples from Madagascar of the genus Caulerpa, Halimeda and Codium. The methods I will be using during my internship consist in extracting DNA from the samples, amplifying it by polymerase chain reaction (PCR) and sequencing the fragments. In fine, they will allow me to construct phylogenetic trees and evaluate the diversity of green macroalgae in Madagascar. Molecular phylogeny, based on genetic sequences, is necessary to resolve uncertainties linked to morphological taxonomy, which uses macroscopic characteristics to hint at a genus’ evolution. By sampling a wide range of individuals in a certain region, we can better understand the unique evolutionary history of this particular oceanic area and who knows, maybe discover an unusual specie there. For the moment, I have tested samples from several different genre with existing protocols from previous interns. I evaluated the quality of my DNA extractions by estimating the quantity of DNA by absorbance. I also visualized the success of my PCRs, this time by electrophoresis, and was generally pleased with my first results, which showed I had an important amount of DNA that had been efficiently amplified. I just need to sequence these fragments to make sure that they belong to the right genus. To “feed my lab sessions with reflexion” like my internship director says, I have also done bibliography on the topics of molecular phylogeny, of macroalgae taxonomy and biodiversity in Madagascar. You might be wondering what these algae look like, here is a glimpse! Source:
H. Verbruggen et al. (2009). A multi-locus phylogeny of the siphonous green algae. Molecular Phylogenetics and Evolution |
Search the site...
Photo used under Creative Commons from DJANDYW.COM & DJANDYW.TV AKA ANDREW WILLARD
