|
The difference between the electrocardiograph and the Holter
Some cardiac disorders diagnosis with the Holter Starting from several basic characteristics of a normal ECG [7] [8], it is possible for doctors and cardiologists to detect multiple pathologies that show specific parameters and electrocardiogram models. Atrial fibrillation (AF) This pathology corresponds to a heart activity problem characterized by a fast and non-regular auricles beat leading to an irregular contraction of ventricles. It is a common disorder especially for elderly people and up-to-60 years people more likely to appear in people with other cardiac problems (hypertension, coronary artery disease …), with previous heart surgery but also lung disorders, obesity and high alcohol consumption. [9] [10] [11] 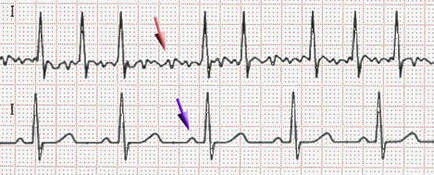 ECG in AF (at the top) and normal conditions (at the bottom). Purple arrow indicates the position of the P-wave and red arrow some shivers. We can notice that the heart beating is irregular and non-coordinated, P-wave (auricles contraction) is missing in the recording. From Wikipedia. Ventricular fibrillation (VF) This pathology refers to a heart rhythm irregularity localized on the ventricles. Instead of realizing a normal beating behaviour, the heart undertakes shivers due to myocardium fibers contractions disorder since they each have their own electrical activity (they are not contracting at the same time). Ventricular fibrillation manifests through a sudden cardiac arrest and a loss of consciousness. In the absence of treatment (cardiopulmonary resuscitation and defibrillation), complications happen leading to death making ventricular fibrillation as a serious cause of cardiac arrest (around 10%). It is more likely to happen with diseased hearts and cardiac diseases predisposition (cardiomyopathy, blood flow, coronary heart disease, valvular heart disease …), drugs overdose or sepsis. [12] [13] [14] [15] 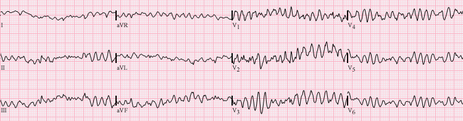 ECG in ventricular fibrillation. It shows fast and irregular oscillations of varying amplitude. No P waves, QRS complexes, or T waves are identifiables. From Wikipedia. Ventricular tachycardia (VT) Also know as V-tach, it consists in an abnormal fast heart rate localized on the ventricles. Normally initiated at the sinus node of the heart, electrical signals start in the ventricles from new autonomous cells gathered on what we call the ectopic pacemaker [16]. This region then causes premature ventricular contractions (or PVCs) [17] which can be very worrying in the case of at least three consecutive ones. Moreover, tachycardia implies a substantial heart activity with at least 100/120 beats per minute (bpm) and even 250 bpm in the framework of cardiac complications like sudden cardiac death. Due to this very fast heart activity, blood flows and pumping are critically reduced leading to very low brain and the body oxygenation. Some symptoms are known like lightheadedness, palpitations, fainting, chest pain just like the main causes which are mainly about cardiac disease predisposition (cardiomyopathy, blood flow, coronary heart disease, previous heart attack), electrolyte imbalance, anxiety, overdose or drugs. [18] [19] [20] 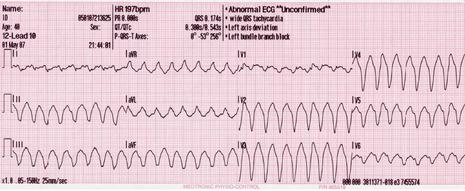 ECG in ventricular tachycardia. It shows fast oscillations with large QRS complexes and dissociated P waves which have their own rhythm. From Wikimedia Commons. 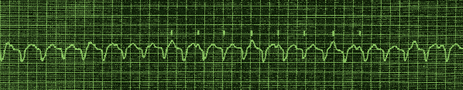 ECG in ventricular tachycardia with dissociated auricles. It shows large QRS complex and slower, regular and independent P waves from auricles (marked with dashes). From sante.ujf-grenoble.fr. Torsades de pointes “Twisting of the points” in english, this phenomena is an abnormal heart rhythm under the form of polymorphic tachycardia easily visible on an ECG. It generally appears following long-QT syndrome and starts with a phase of premature ventricular extrasystoles. If non-treated, the pathology can degenerate into ventricular fibrillation (VF) and at long-term in cardiac death. 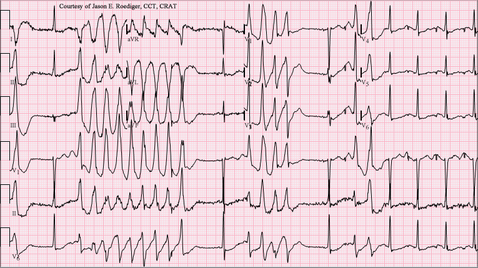 From Wikipedia. REFERENCES [1] ‘Special ECG, Holter, Formation à « l’ECG de A à Z » Par Pierre Taboulet’. Accessed 22 August 2017. http://www.e-cardiogram.com/ecg-lexique_theme.php?id_th=2&id_lex=146&PHPSESSID=47c4a327a3fd37f65869199137e327e2. [2] ‘ECG filter, Formation à « l’ECG de A à Z » Par Pierre Taboulet’. Accessed 22 August 2017. http://www.e-cardiogram.com/ecg-lexique_theme.php?id_th=2&id_lex=191&PHPSESSID=3028abdc64531925627b0c2817367a86. [3] ‘Electrocardiograph, Formation à « l’ECG de A à Z » Par Pierre Taboulet’. Accessed 22 August 2017. http://www.e-cardiogram.com/ecg-lexique_theme.php?id_th=2&id_lex=155&PHPSESSID=47c4a327a3fd37f65869199137e327e2. [4] ‘Électrocardiographie’. Wikipédia, 6 August 2017. https://fr.wikipedia.org/w/index.php?title=%C3%89lectrocardiographie&oldid=139534512. [5] García‐Niebla, J., Llontop‐García, P., Valle‐Racero, J. I., Serra‐Autonell, G., Batchvarov, V. N., & De Luna, A. B. (2009). Technical mistakes during the acquisition of the electrocardiogram. Annals of Noninvasive Electrocardiology, 14(4), 389-403. [6] ‘Holter cardiaque’. Wikipédia, 8 June 2017. https://fr.wikipedia.org/w/index.php?title=Holter_cardiaque&oldid=138018882. [7]‘Electrocardiography’. Wikipedia, 22 August 2017. https://en.wikipedia.org/w/index.php?title=Electrocardiography&oldid=796640800. [8] ‘Sémiologie et Pathologie Cardiovasculaires - L’Eléctrocardiogramme - Service de Cardiologie Du CHRU de Grenoble’. Accessed 17 August 2017. http://www-sante.ujf-grenoble.fr/SANTE/CardioCD/cardio/chapitre/301.htm. [9] Magnani, J. W., Hylek, E. M., & Apovian, C. M. (2013). Obesity Begets Atrial Fibrillation. Circulation, 128(4), 401-405. [10] Tonelo, D., Providência, R., & Gonçalves, L. (2013). Holiday heart syndrome revisited after 34 years. Arquivos brasileiros de cardiologia, 101(2), 183-189. [11] Abed, H. S., & Wittert, G. A. (2013). Obesity and atrial fibrillation. Obesity Reviews, 14(11), 929-938. [12] ‘Sepsis’. Wikipedia, 18 August 2017. https://en.wikipedia.org/w/index.php?title=Sepsis&oldid=796087587. [13] Cobb, L. A., Fahrenbruch, C. E., Olsufka, M., & Copass, M. K. (2002). Changing incidence of out-of-hospital ventricular fibrillation, 1980-2000. Jama, 288(23), 3008-3013. [14] Mogayzel, C., Quan, L., Graves, J. R., Tiedeman, D., Fahrenbruch, C., & Herndon, P. (1995). Out-of-hospital ventricular fibrillation in children and adolescents: causes and outcomes. Annals of emergency medicine, 25(4), 484-491. [15] Isner, J. M., Estes III, N. M., Thompson, P. D., Costanzo-Nordin, M. R., Subramanian, R., Miller, G., ... & Sturner, W. Q. (1986). Acute cardiac events temporally related to cocaine abuse. New England Journal of Medicine, 315(23), 1438-1443. [16] ‘Ectopic Pacemaker’. Wikipedia, 12 March 2017. https://en.wikipedia.org/w/index.php?title=Ectopic_pacemaker&oldid=770003753. [17] Osmosis. Premature Ventricular Contraction - Causes, Symptoms, Diagnosis, Treatment, Pathology, 2017. https://www.youtube.com/watch?v=wCC2bmBkpSo. [18] Bigger, J. T., Fleiss, J. L., Rolnitzky, L. M., & Groupab, T. M. P. I. R. (1986). Prevalence, characteristics and significance of ventricular tachycardia detected by 24-hour continuous electrocardiographic recordings in the late hospital phase of acute myocardial infarction. The American journal of cardiology, 58(13), 1151-1160. [19] Watkins, L. L., Blumenthal, J. A., Davidson, J. R., Babyak, M. A., McCants Jr, C. B., & Sketch Jr, M. H. (2006). Phobic anxiety, depression, and risk of ventricular arrhythmias in patients with coronary heart disease. Psychosomatic Medicine, 68(5), 651-656. [20] Chudin, E., Goldhaber, J., Garfinkel, A., Weiss, J., & Kogan, B. (1999). Intracellular Ca 2+ dynamics and the stability of ventricular tachycardia. Biophysical journal, 77(6), 2930-2941. Other sources
0 Comments
Let's begin with the basics ... ECG, or electrocardiogram, corresponds to the heart electrical activity representation made using an electrocardiograph. It is a critical tool, non-invasive, very cheap and highly usual examination used in electrocardiography to discover most of existing cardiac pathologies. [1] [2] [3] Heart scientific approach
The right part of the heart (the first pump) is dedicated to carry deoxygenated blood from the organs and muscles to lung’s capillaries to undergo gas exchanges with the external environment: O2 is recovered whereas CO2 is discharged. Afterwards, the left part of the heart (the second pump) carries the oxygenated blood directly to all body organs and muscles which will absorb it as well as nutrients to finally release wastes and CO2.
ECG functionning and principles These are these different electrical activities behaviours (in this case, their amplitude variation or electrical potential variation to be more precise) that we are trying to detect using an electrocardiograph depending on the time. Indeed, these different steps can be recognized by the different phases found in it. 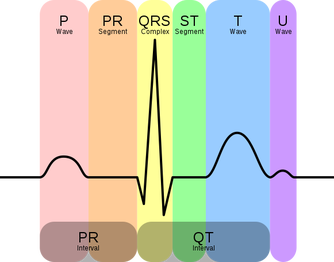 Graphical representation of a ECG from a healthy patient. P wave: auricular depolarization; QRS complex: ventricular depolarization; T wave: ventricular repolarization; PR and ST segment: latency isoelectric period. From Wikimedia Commons. Finally, we usually measure the heart activity thanks to at least two electrodes that will enable to get the heart activity under the form of an ECG. As the heart is an three-dimensional organ, the two electrodes will give us this activity under the form of a single vector called leads. Thus, depending on the position and the number of electrodes (12 maximum) placed according to the Einthoven’s triangle, we will obtain different leads and then different information about heart activity as for proper functioning as for proper morphology.
REFERENCES
[1] ‘Cours - Cardiologie - L’électrocardiogramme, Les Bases Pour Comprendre (1ère Partie)’. Infirmiers.Com, 9 April 2009. http://www.infirmiers.com/etudiants-en-ifsi/cours/cours-cardiologie-lelectrocardiogramme-les-bases-pour-comprendre-1ere-partie.html. [2] ‘Électrocardiogramme : Fonctionnement et Applications - Ooreka’. Ooreka.Fr. Accessed 16 August 2017. https://defibrillateur.ooreka.fr/comprendre/electrocardiogramme. [3] ‘Heart’. Wikipedia, 2 August 2017. https://en.wikipedia.org/w/index.php?title=Heart&oldid=793554003. [4] ‘Myocyte’. Wikipédia, 24 April 2017. https://fr.wikipedia.org/w/index.php?title=Myocyte&oldid=136753036. [5] Bonny, A., Lele, E. C. B., Mandengue, S., Larrazet, F., & Amara, W. (2013). Différences ethniques de l’électrocardiogramme entre une population de noirs africains et de blancs européens âgés de moins de 35ans. La Presse Médicale, 42(4), e96-e105. [6] Macfarlane, P. W., McLaughlin, S. C., Devine, B., & Yang, T. F. (1994). Effects of age, sex, and race on ECG interval measurements. Journal of Electrocardiology, 27, 14-19. [7] Devi, M. R., Arvind, T., & Kumar, P. S. (2013). ECG Changes in smokers and non smokers-a comparative study. Journal of clinical and diagnostic research: JCDR, 7(5), 824. [8] Murata, K., Landrigan, P. J., & Araki, S. (1992). Effects of age, heart rate, gender, tobacco and alcohol ingestion on RR interval variability in human ECG. Journal of the autonomic nervous system, 37(3), 199-206. [9] Cellina, G. U., Honour, A. J., & Littler, W. A. (1975). Direct arterial pressure, heart rate, and electrocardiogram during cigarette smoking in unrestricted patients. American heart journal, 89(1), 18-25. [10] FRIEDMAN, L. A., & Kimball, A. W. (1986). Coronary heart disease mortality and alcohol consumption in Framingham. American Journal of Epidemiology, 124(3), 481-489. [11] Evans, W. (1959). The electrocardiogram of alcoholic cardiomyopathy. British heart journal, 21(4), 445. Other sources
As we said earlier in the week, every part of a data analysis is independently important, with it own fundamental method and results. Commonly, after collecting the data comes a phase of purification. During my internship, this stage consists in deleting the unfinished and poorly filled survey from the database. It was done without forgetting that every action I took was registered and ready to be drawn in case of unclarity during the redaction of the report. Once that step complete, I could proceed to the captivating part: The analysis.
By looking at a graph (Fig.1), a person can predict if there is a correlation in the data. However, if the points were more scattered would that mean that there is no correlation? In the case of Fig.1 we could also say that the possible correlation is positive; indeed, as x increase, y seem to increase too. 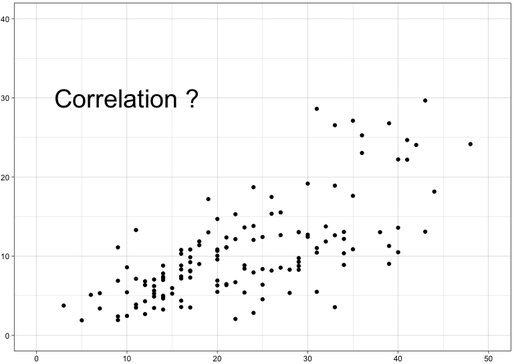 Fig.1 Example of dataset. When it comes to determining the strengths of a relation between two variable we usually use the Pearson moment correlation coefficient (PMCC) also commonly named: correlation coefficient r or r2. Keep in mind that r is staked between -1 and 1, value close to 0 meaning that the correlation is null or weak. In Fig.2 we can see the different score we can observe when using the PCMM. As you can imagine, outliers can be a problem in the calculation of r. Don't forget that r isn't the slope of the linear regression of your data; nevertheless, if r is positive, the slope coefficient will be positive too, the same goes for negativity. 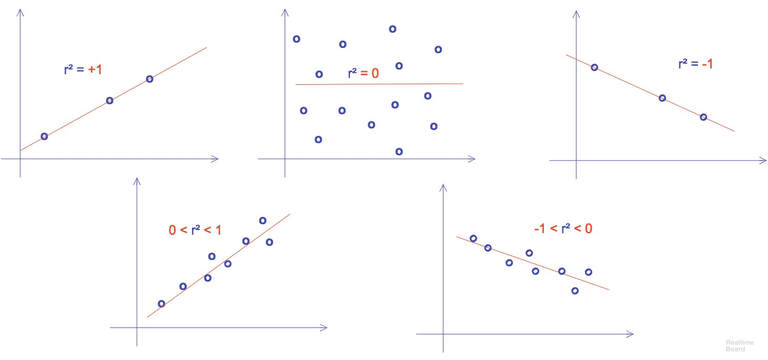 Fig.2 Different example of r results when apply to more or less correlate set of data The expressions of the PCMM depends on the format of the data you're using; generally, for a sample of data we use the formula: 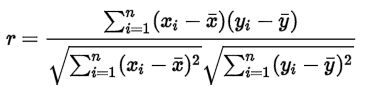 https://en.wikipedia.org/wiki/Pearson_correlation_coefficient Where x and y represent the coordinate of each studied points. r can also be found in the literature as rxy to emphasize the two variable. It is important to remember that r isn't a robust statistical object. Like the p-value, r is interpretable under particular conditions. In order to consider r correctly we can apply formulas of hypothesis testing and determine how significant the result is. Like we saw earlier if r=0, b the slope regression coefficient will also be equal to 0. We can take as the null hypothesis (Ho: b=0) and the alternative hypothesis (Ha: b/=0); since the sampling distribution of the regression coefficient is a t-distribution, we can compute the standard error of the coefficient using 2 degrees of freedom.
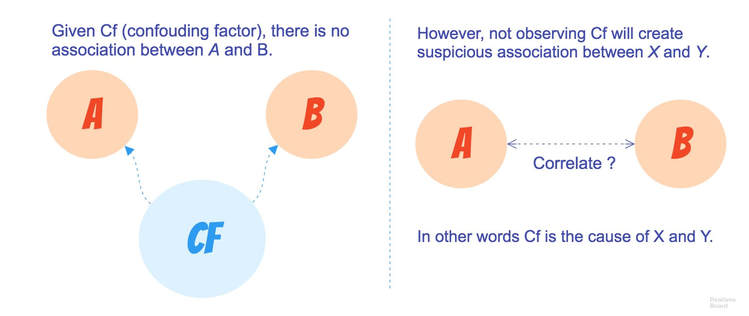 Fig.3 What is a confounding factor ? Biserial / Point-biserial correlation ------------------------------------ During my internship, I once use a database gathering for each word of a spelling task whether the word was well or poorly spelled for each one of the subjects. I had to observe the correlation between the score of every subject separately on the entirety of the task against the result of the item for each person. A simple PMCC isn't appropriate for this kind of data, and I had to use something else.
Numerous statistical test exists for almost all kind of data and situation. As times pass multiple packages, emerge for informatical language allowing to use them in the most efficient ways. Reference -----------
When Einstein enters the Olympia Academy in 1902 on of his first recommended study was "The grammar of science" from Pearson. Even if Pearson vision of the relativity was conceptual the next to be influential scientific of the century doesn't miss to refer to him in his preliminary work. Pearson work has been electronically saved and shared across the world; I invite you to read the preface of this book.
Pearson, K. (1911). The grammar of science. London: Black. https://archive.org/stream/grammarofscience00pearrich#page/n9/mode/2up Introduction ------------- As you read this blog post, your brain is processing a lot of operations; this goes from this interpretation of the raws data display by your screen on your retina, to the well understanding of each word. Today's post will be more about this first step of the word recognition. Which mechanisms are involved in the traduction of a raw visual information in an abstract representation of the letter we're viewing?
Conclusion ------------ The Pandemonium is an oversimplification of the physiological action that our brain process during reading. However, it still describes accurately the central processes occurring in our primal visual area. We will see later that additional question has called this model into consideration. Reference -----------
WHAT's THE POINT? Profiling heroin samples consists of collecting data concerning key impurities in heroin and associating this data to the original batch the heroin was sampled from. This allows for different heroin profiles to be compared. The use of profiling is similar to the concept behind collecting fingerprints and DNA samples. The idea is to create a large database with impurity data from as many heroin samples as possible. This allows for newly found samples to be compared to previously acquired samples, based on the dosage of impurities within it. If two powders possess the same proportions of characteristic impurities within them, one can assume they were created following the same fabrication process, and therefore possess the same origin, traffic routes and dealers. This allows a wealth of information to be acquired. If a given type of heroin continues to appear on the street long after an arrest, it can be assumed this traffic source has not been entirely or effectively dismantled. In addition, information from the fabrication process can be used to hypothesize where fabrication might have taken place and also what precursors(commercial chemicals used in the creation of illicit drugs) were used, which is helpful for precursor-monitoring programs. Information as to the health risks associated with a given drug can also be extracted from heroin profiling allowing authorities and awareness initiatives to work more effectively for health and safety purposes. The United Nations Office on Drugs and Crime(UNODC) Identifies two main purposes for drug profiling: tactical ones and strategic ones. Tactical ones serve to gather intelligence as to the range and size of a trafficking network while strategic ones serve as information on how drugs are made and handled. The UNODC claims “ For drugs derived from plant sources it is most often possible to assign geographical origin, if at all, in only the most tentative sense when the analytical technique employed exclusively targets the major alkaloids. However, there are notable exceptions, perhaps the most notable being those heroin samples originating in South-East Asia. The relative ratios of the alkaloids present in the majority of South-East Asian heroin samples are distinctly different from those found in heroin samples originating in other source regions. As a result, many South-East Asian heroin samples can, with reasonable certainty, be distinguished from those samples originating elsewhere simply by comparison of major alkaloid analyses.” This shows the usefulness of using data from the chemical composition of heroin seizures to determine the geographical location of where heroin is manufactured. SO HOW IS IT DONE? To acquire data on heroin samples that are brought in by the police, heroin laboratories can use different methods. Forensic laboratories in France are currently beginning to share their methods in order to standardize them and therefore be able to share databases. Many different methods are described in the UNODC's "Methods for impurity profiling for heroin and cocaine". To study the proportions of impurities found in heroin, they need to be separated. Profiling usually focuses on organic impurities, and therefore a method for detecting organic molecules is necessary. Most often, this is done by dissolving the heroin samples into an organic solvent(for example, chloroform). These samples are then used for Gas Chromatography with a Flame Ionization Detector(GC-FID). The way this machine works was described in a previous blog post. To state the mechanism simply, the machine separates the impurities of interest and the solvent and then passes them through detector. A computer records all data from the detector, and tags the peaks on the resulting chromatograms with molecules they characterize. The computer automatically calculates the area underneath of each of the peaks, the area of these peaks being proportional to the quantity of the chemical present in the sample. In the Toulouse Forensic Laboratory, five typical impurities are paid attention to: acetylthebaol(ACTH), acetylcodein(AC), 06-acetylmorphine(06-MAM), papaverine(PAP) and noscapine(NOS). 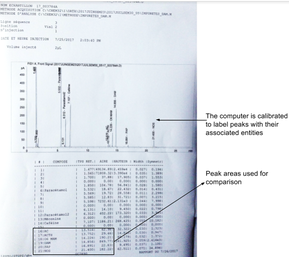 A typical chromatogram of a heroin sample after GC-FID. In the Toulouse Forensic laboratory, the areas of each of the five peaks that represent the aforementioned molecules are entered into a database named OTARIES, as well as the area of the peak representing diacetylmorphine(the name of the heroin molecule). This software can then used to compare the data from the heroin sample to all others that have been entered in the database. For the comparison to be made, two samples are chosen, and each of the areas from the impurity peaks are normalized(divided) by the area of the peak for diacetylmorphine and then the five impurity values are entered into a mathematical formula wich calculates what is called called the square cosine similarity(then multiplied by 100). This formula returns a value between 0 and 100 based on how similar the proportions of impurities are. If the value is 100, the two samples are identical, and if the value trends towards 0, then the samples are extremely different, and are therefore unlikely to have originated from the same batch. 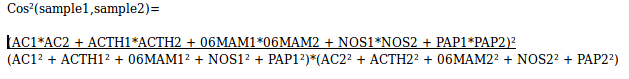 The software OTARIES will list all samples in the database that result in similarity values that exceed the value 99.85. If the value exceeds 99.92, then forensic analysts will consider that samples are from the same batch and geographical origin. If the value is between 99.85 and 99.92, then the test was inconclusive and otherwise, the samples are not considered to be linked. All samples must be run twice to confirm the results of the test by replicate.
For interpreting results, there is no standardized method, and the use of cosine similarity is only typical of laboratories in Lyon and Toulouse in France. This has made data sharing difficult and therefore databases are not always very complete, therefore hindering the usefulness of the process. However, as more samples ares seized by authorities, the database will grow and profiling become a more reliable method of intelligence gathering. After this, the forensic analyst sends his report and conclusions to the judge that has ordered the profiling to be made. Sources: 1. Toulouse Forensic Laboratory Staff and Protocols 2.“A quick and automated method for profiling heroin samples for tactical intelligence purposes”. Dufey V., Dujourdy L., Besacier F., Chaudron H., LPS LYON, 2006. 3. UNODC, "Methods for Impurity Profiling of Heroin and Cocaine", 2005 4. Map Image: United Nations Office on Drugs and Crime, Drug Trafficking, https://www.unodc.org/unodc/en/drug-trafficking/, consulted July 2017 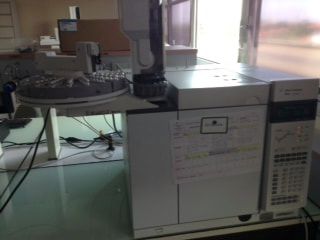 A GC-FID machine fit with an automatic injector that can store up to 100 sample vials. A GC-FID machine fit with an automatic injector that can store up to 100 sample vials. GC-FID stands for Gas Chromatography with a flame ionization detector. Like all chromatographies, the method consists of separating the chemical elements of a mixture, and in this case, the mobile phase is a gas(most often helium). During gas chromatography, the mixture of interest is injected with a syringe into a gas chromatogram machine. This machine heats the mixture at different temperatures according to time. This will vaporize the liquid mixture, which will then be carried by the helium gas through the column. The column is a long, thin and coiled metal tube, coated in a liquid(this liquid is the stationary phase). As the helium carries the mixture through the column, the elements composing it will separate because of their different weights and sizes, and their boiling points. Molecules with high boiling points interact with the liquid on the walls of the column, slowing down their progression towards the detector, while molecules with lower boiling points will be carried toward the detector faster. The polarity of a molecule will also affect the speed at which it traverses the column. The time an element takes to reach the detector is known as it's retention time, or the time the column has retained the substance. A chemical entity has one characteristic retention time. Therefore, one can identify the components of a mixture by determining their retention times. This is exactly what GC-FID does. It is also important to know that column is kept in a compartment called an oven, which maintains an appropriate temperature for the analytes to remain in gaseous form. 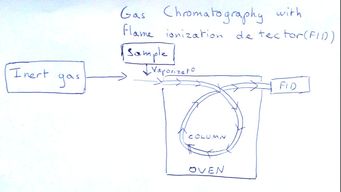 A simple schematic showing the different parts of a GC machine A simple schematic showing the different parts of a GC machine Once the compounds of the mixture are separated, they pass a detector at the end of the column, the Flame Ionization Detector(FID). This detector detects only organic molecules. The FID consists of a hydrogen flame that will pyrolyze any organic compounds coming out of the column, meaning the heat of the flame will help produce ions from these compounds. These ions will produce an electrical signal that can be measured with a metal "collector". On the chromatogram, a graph of the detector response as a function of time, a peak will appear as this electrical signal is produced. The area under the peak will be proportional in size to the amount of ionized compound, therefore to the amount of that compound in the initial mixture. Indeed, the more of a given molecule there is, the more ions will be produced, therefore creating a larger electrical signal and a larger peak on the chromatogram. When many samples need to be tested, an automated syringe with a vile holder is put in place for injecting samples. One vial at a time, the syringe will pierce the red rubber tops of the vials to retrieve samples and then inject them into the GC machine for chromatography. Important remarks: - The carrier gas must be an inert gas, otherwise it might react with the mixture you wish to analyze and modify it's contents, falsifying your results. - It is important for the solvent used in the mixture you are analyzing to have a lower boiling point than any of the other elements you intend on detecting. Otherwise, the signal caused by the solvent will find itself in the middle of your chromatogram, making interpretation difficult if not impossible. - The liquid in the column must be a liquid with a higher-boiling than any of the any of the oven temperatures. Otherwise, it will vaporize and be detected among the rest of your mixture. 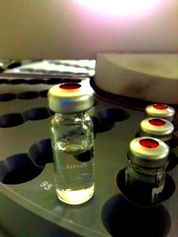 A classic injection vial for a GC machine. A classic injection vial for a GC machine. Gas chromatography and flame ionization detection is useful for many fields of sciences. At the Police Forensics Laboratory in Toulouse, France, Forensic analysts in the narcotics department use gas chromatography to separate out the major impurities in diacetylmorphine powder(commonly known as heroin). By doing this on several heroin samples, analysts can compare the proportions of of each impurity to determine the chemical similarity between samples. If two samples are very close in chemical composition(or proportional), they are considered to have the same geographical origin, as well as traffic route and manufacturing process. This process is called heroin profiling and is important for the gathering of evidence for one investigation and the evaluation of an illicit market's geographical spread. In Toulouse and Lyon, the forensics department is working on OTARIES, a software that compares chromatograms saved on a computer and determines which samples can be considered as linked. 1. American Medical Colleges and Khan Academy, Gas Chromatography | Chemical Processes, https://www.youtube.com/watch?v=4Xaa9WdXVTM, consulted July 11th, 2017
2. Woodford, C., Chromatography, Explain Tha Stuff!, http://www.explainthatstuff.com/chromatography.html, consulted July 11th, 2017 3. Wikipedia, the free encyclopedia, Gas Chromatography, https://en.wikipedia.org/wiki/Gas_chromatography, consulted July 11th, 2017 4. Wikipedia, the free encyclopedia, Flame Ionization Detector, https://en.wikipedia.org/wiki/Flame_ionization_detector, consulted July 11th, 2017 5. Shomu's Biology, Gas chromatography | working principle and instrumentation lecture, https://www.youtube.com/watch?v=gU2st5-T1Go, consulted July 11th, 2017 6. Airproducts, https://www.airproducts.com/industries/Analytical-Laboratories/analytical-lab-applications/product-list/gc-with-flame-ionization-detector-gc-fid-analytical-laboratories.aspx?itemId=D6D6641C668A47139A6F1960D9441B93, consulted July 11th, 2017 7. Cambustion, Fast FID Principles, http://www.cambustion.com/products/hfr500/fast-fid-principles, consulted July 11th, 2017 Acoustical analysis are a very used tool in psycholinguistics. They are useful when it comes to know where the target word in a recording has been said or which is the prosody of the said speech, for example. And that makes them really interesting! Here you have three of the most interesting things I found about acoustical analysis: Once you started, YOU have to go until the end Acoustical analysis are very personal. Than means that even if I tell you all the things I took in consideration to do an acoustical analysis, you’ll hardly ever be able to do exactly the same I’ve done. That’s why, once started, you can’t pass the torch to another person. Sometimes… You don’t need to listen to do an acoustical analysis! Acoustical sounds have patterns in depending on which sound they are encoding. For example, vowel sounds have a periodic waveform while consonants like p or c have a strong release of air when pronounced (see Figure 1). 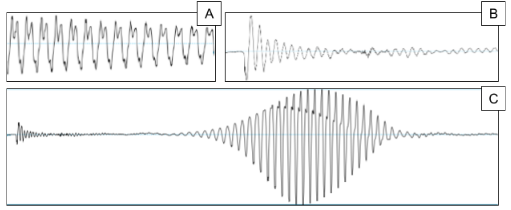 Figure 1 (token from a Praat Speech Analyzer’s opened file). We can see (A) the acoustical wave of an /ɔ/, periodic waveform, (B) the acoustical wave of a /k/, with a great release of air at the beginning and then a non- periodic waveform and, finally, (C) the acoustical wave of a french ‘cou’ (pronounced /ku/); we can see that the part in green (/k/) starts directly with an explosion of air whereas the part in yellow (/u/) starts and ends progressively. Knowing features like this, about waveforms… Researchers can analyse acoustical waves without listening! Isn’t that amazing? Prosody is, in fact, very important in experiments like ours Another great thing about acoustical analysis is that you can extract is the prosody of a speech (its intonation, tone, stress and rhythm). In experiments like ours, where we replace one function word for an invented one, we want to make sure that the prosody of the new syntactic context will be the same as the one of the known one (to reduce the maximal number of variables). That’s why, having access to it, it allows us to compare both curves (see Figure 2). 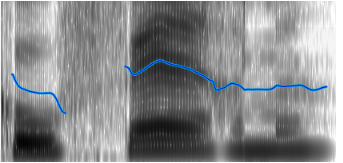 Figure 2. The blue curve is an example of the sentence ‘ko ferme’’s prosody.
And why you may have read a "your" instead of a "you" in the title... Preliminaries -------------- In the environment we perceive, our brain experience a continuous flow of information, the greatest challenge of our cognition is to find structure and pattern in it. Hearing or reading are events that occur at a particular time in a certain order (Elman JL. 1990 Finding structure in time [1]) this mean that we have to save and process these data in real time. But how the brain extract the information in a steady stream of data? How can we know where a word start and ends? Furthermore, how a newborn infant can do it with no database in syntactic recognition? Trough the years of research a lot of theory has been proposed, today we will focus on tow of them. The statistical learning and the TRACX1/2 model. Transitional Probability (TP) ------------------------------ The first one repose on the principle of prediction. Roughly, it supposes that we can determine the boundary of a word by finding a low transitional probability (TP). The TPs, introduced by Saffran & al. [2] resume what the brain has seen around individual letters, it constructs an internal representation of the likelihood of finding an element next to another. (fig.1.) A high TP should mean that the word isn't finished while a little TP supposes that we encounter a boundary. Tummeltshammer & al.[3] Proved that backward TP also exists and are fully functional.
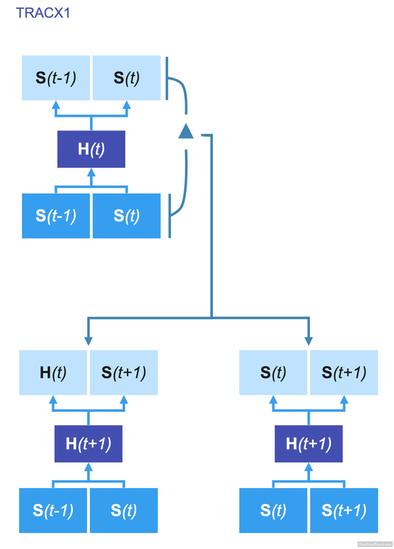 fig.3 Shematic of TRACX1 fig.3 Shematic of TRACX1 TRACX1 --------- French RM & al [4] proposed an alternative solution to this question. Considering the ability that the brain has to change the weight between neuronal units they were able to create TRACX1, an autoencoder learning by chunking the information. TRACX1 reflexion isn't based on the prediction but, on the memory of the previous encounter. It asks to itself "Have I see that before?" if yes, it chunk the lexical unit in one, thus, the more it sees a word, the more it will recognize it. In the fig.3 we can see this process occurring in a neural network. The neural layer on the bottom is receiving the information. This information consists of tow syllable to compare. Once encrypted, the data is transmitted it to the hidden layer. This one process the computation "have I saw it before?" at the time (t). Once done, it gives a Criterion that determines the weight in the neural network at the time (t+1). At (t+1), if S(t-1) and S(t) were supposed to be part of the same word they will be chunked. If not, TRACX will proceed to the new pair of syllables. But there is still a problem; as you know, the brain isn't an easy thing to simulate. This system is efficient but still, contain contain an If/Then/Else condition, which is critical. 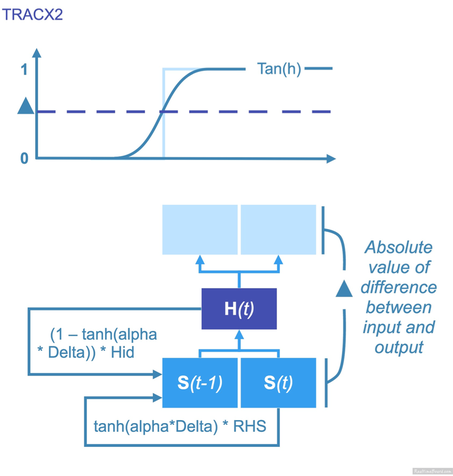 fig.4 Schematic of TRACX2 fig.4 Schematic of TRACX2 Cognition doesn't work like that, is an oversimplification to say that we process learning binary. Regarding this element of the procedure, the authors proposed in 2014 a new way of making the decision (French RM & al [5]). Using the sigmoïde function, TRACX2 is now able to "smooth" the choosing procedure. TRACX2 --------- TRACX2 (Mareschal D & al [6])will sequentially put the information in the right blank (RHS); a hybrid consisting of the right blank and the information from the hidden unit activations at the previous time step will fill the left blank. On the fig.4 we can see the sum of this two section occurring in the left lowest blank. To clarify these equations, Delta represents the absolute maximal error in the node network at time t. Alpha is the determinant of the weight of the contribution of the right-handed blank. In these procedures, the information contained in the hidden layer is already encrypted and representing the computation done on two objects. A small delta signifies that the system as frequently find these two object together, if not that means they syllables weren't commonly chunked. This method determines TRACX2 learn from his input and improve his capacity through time and experience. Summing-Up -------------- According to "TRACX2: a connectionist autoencoder using graded chunks to model infant visual statistical learning. ", this model integrates the information at a slightly higher rate than an eight month-infant. We could also find proof of this memory-chunking operation in our everyday language. This last evidence is also a point where the TRACX system has to be more efficient. We talk about "football" or in French "Avenir". Our brain brought the word in one piece even if we know it comes from these, TRACX doesn't know how to differentiate a created and false name from a real one. References ------------
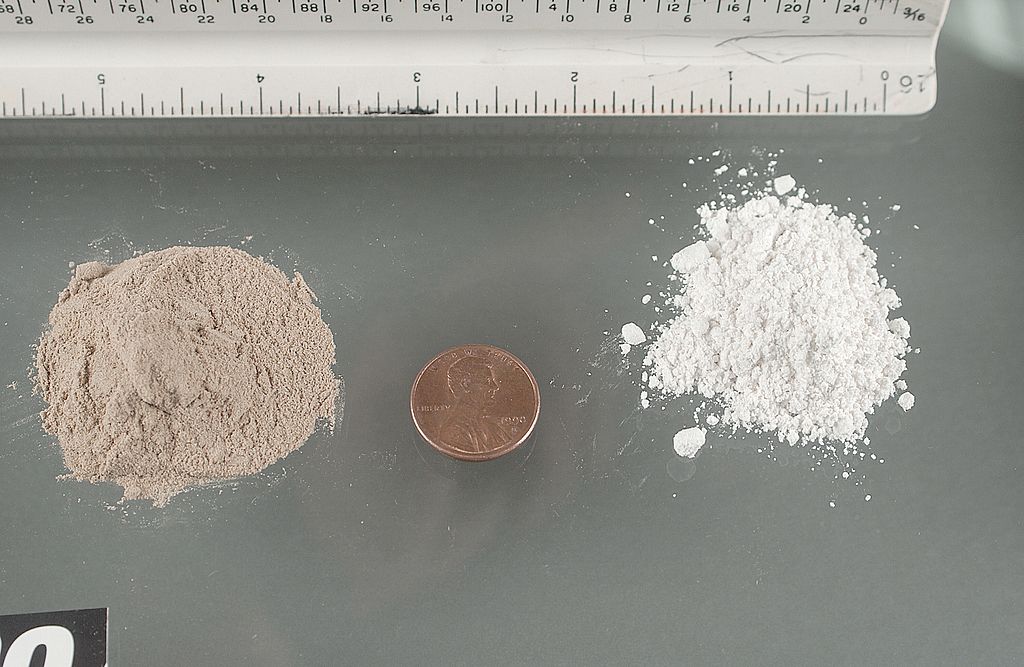 Heroin is one of the most seized illicit drugs in France Heroin is one of the most seized illicit drugs in France HEROIN IN FRANCE The drug market in France is quite lucrative for those involved, if they don't get caught. The profitable aspect of this drug trafficking has contributed to making Heroin one of the more prevalent drugs in the country. In 2015 alone, over 800 kilograms of heroin were seized by authorities. So far in 2017, it is the fourth most seized drug by authorities, after cannabis herb and resin, as well as cocaine. 20% of over 150 000 drug users who sought treatment for substance abuse in 2017, came because of heroin use. The number of patients seeking treatment due to the drug has begun increasing again since 2014. Currently, EUROSTAT estimates there are are between 180 and 300 000 opioid users in France, making it one of the highest rates of high risk opioid use in Europe, comparable only to the UK, Italy, Austria and Malta. Although many countries in EU fare worse than France when it comes to the negative effects of heroin, the situation is alarming. Authorities and Forensic experts spend much time and resources studying the chemical compositions of acquired heroin packages to determine the origin and fabrication process of the drug. Knowing the proportion of impurities in a heroin sample can help associate it with a specific trafficking route, helping to pinpoint where it comes from and hopefully help dismantle the trade. So where does heroin come from and how is it made? 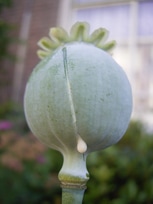 Latex from a Papaver somniferum pod Latex from a Papaver somniferum pod ORIGIN It is estimated that about 90% of the world's illicitly sold heroin originates from Afghanistan. The ongoing war, civil unrest and poverty has decimated the country's economy, leaving most inhabitants to farm opium poppies. The bulk of the rest comes from southeast Asia, in a region called the golden triangle which spreads over Myanmar, Laos and Cambodia. It fares well in warm, temperate climates and low humidity. The drug originates from the poppy flower(Papaver somniferum), which is massively cultivated as a way of life in Afghanistan. These plants grow pods that contain latex, which contains opium itself. This opium is recuperated from the pods, dissolved in hot water to separate it from dirt and other unwanted substances. Then calcium hydroxide is added to convert morphine to calcium morphenate, which will dissolve in water, while most other unwanted substances will precipitate. The solution and the précipité are then separated. Typically, ammonium chloride is then added to the calcium morphenate solution. The reaction recreates morphine base, which will separate from the water and be retrievable as a solid by filter. To augment purity, the morphine base will be dissolved in hydrochloric acid and reheated and re-filtered several times. This will yield morphine hydrochloride powder, which will then be used to fabricate morphine in specific laboratories. 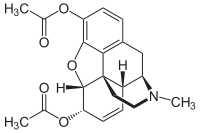 Classic representation of Diacetylmorphine(heroin). Classic representation of Diacetylmorphine(heroin). FABRICATION The U.S. Drug Enforcement Administration(DEA) released a report in 1992 detailing the typical process by which heroin is made. Here, the point of this blog post is not to create an instruction manual on how to create heroin(for obvious reasons), but rather to understand the chemistry and concepts that go into it's creation. Street heroin is often found in two different forms. The most common(around 90% of the seizures), it comes in the base form, a brown/beige powder that does not dissolve in water. It can also be found as a salt compound with hydrochloric acid, forming heroin hydrochloride. The heroin molecule(also named diacetylmorphine[DAM] or simply diamorphine) is an organic molecule that is obtained from the double acylation of the morphine molecule that is obtained from poppies. Acetylation is a chemical reaction that adds an acetyl functional group to a molecule. Heroin possesses two more acetyl groups than morphine. The reaction therefore functions as a addition/elimination mechanism. It was first discovered by american scientists in the 1870s who hoped to create a painkiller for soldiers that was less addictive than morphine. Heroin base is not soluble in water. Therefore, before injecting the drug as a liquid, users mix the heroin and water with citric acid. The citric acid releases H+ ions into the water. These are attracted to the nitrogen atom on diacetylmorphine, bringing a positive charge to the heroin molecule and allowing for interactions to take place with polar water molecules. The heroin then becomes soluble. 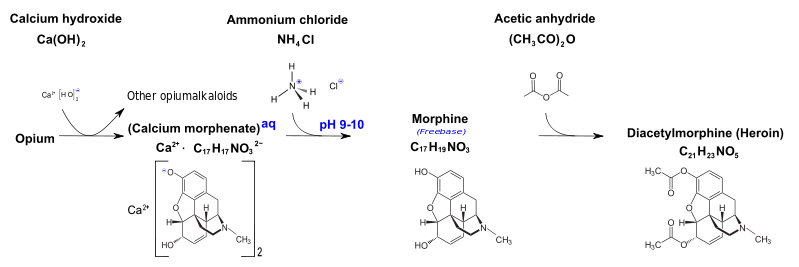 Succession of chemical reactions that are needed to produce Diacetylmorphine. The final product obtained contains impurities such as papaverine, noscapine, and others; Most often, the use of the same fabrication process will yield the same level purity and the same impurities. Understanding the chemistry behind heroin synthesis is important because it helps to understand why certain impurities will occur in the final product, which we will discuss in a later blogpost. These characteristics are then exploited by forensic analysts to profile and compare heroin samples in a large database, but the explanation of that process as well as the appearance of impurities is to be kept for a future post. Sources: All images from wikipedia, labeled for reuse 1. U.S. Department of Justice, Drug Enforcement administration, Office of Intenlligence, Opium poppy cultivation and heroin processing in Southeast Asia, September 1992, https://www.ncjrs.gov/pdffiles1/Digitization/141189NCJRS.pdf consulted july 4th 2017 2. European Monitoring Center or Drugs and Drug Addiction, France Country Drug Report 2017, http://www.emcdda.europa.eu/system/files/publications/4523/TD0416916ENN.pdf, consulted july 4th 2017 3.Conversion of Morphine to Heroin Diacetylmorphine, https://www.pharmacologicalsciences.us/respiratory-depression/conversion-of-morphine-to-heroin-diacetylmorphine.html. Consulted July 4th, 2017. 4. Sellers, K., Why Derivatize? Improving GC separations by derivatization, http://www.restek.fr/pdfs/CFTS1269.pdf, consulted July 4th 2017. 5. Michel, F., Derivatization of polar compounds for GC, https://www.sigmaaldrich.com/content/dam/sigma-aldrich/docs/promo_NOT_INDEXED/General_Information/1/gc-06-derivatization-gc.pdf, consulted July 4th, 2017. 6. Wikipedia, the free encyclopedia, Heroin, https://en.wikipedia.org/wiki/Heroin, consulted july 4th, 2017 7. Wikipedia, the free encyclopedia, Acetylation, https://en.wikipedia.org/wiki/Acetylation, consulted July 4th 2017. The main goal, already presented on the past blog post, of the experiments done during my internship is to see how semantic seed is used to infer a syntactic context and how, this last one, helps us in word categorisation. In other words, to study the existent synergies between semantics and lexical acquisition. To study it, we have been preparing two experiments. The first (that we will call ‘Inference’) is designed for babies from 3 to 4 years old. The second one (this one, we will call it ‘Homophones’), is for babies from 30 to 36 months old. If the Homophone experiment works, the objective is to do it with 20 m.o. babies, shown to be able to categorise new-words’ syntactic category by exploiting function words (Bernal, Lidz, Millotte, & Christophe, 2007; Cauvet et al., 2014; Haryu & Kajikawa, 2016; Shi & Melançon, 2010; Waxman, Lidz, Braun, & Lavin, 2009; Zangl & Fernald, 2007).
Methods The different syntactic context will be presented in two times. The first one will be a five-minutes video composed by four different stories. Each story containing 15 pronouns and 15 articles: the substitution will be to 15 ko’s no matter in which condition are we. The second one will be a practice where the babies will see the video of a known-action and of a known-object at the same time that they listen to the det/pron + noun/verb of the video (for example a video of a girl sleeping at the same time that they listen to ‘look! She’s sleeping’ or ‘look! Ko is sleeping’). So then they will be capable to learn in a different way the new syntactic context. To see where do they look, we use an eye tracker. The test part (to see if they have learned the new syntactic context) will be different for each experiment:
Expected results
What we expect is to confirm The Semantic Seed Hypothesis (Christophe et al. 2016): thanks to a semantic seed, babies would be able to learn new syntactic context (with new function words) and use it to infer the meaning of new words or to recognise between two homophones. References Bernal, S., Lidz, J., Millotte, S., & Christophe, A. (2007). Syntax Constrains the Acquisition of Verb Meaning. Language Learning and Development, 3(4), 325–341. http://doi.org/10.1080/15475440701542609 Cauvet, E., Limissuri, R., Millotte, S., Skoruppa, K., Cabrol, D., & Christophe, A. (2014). Function Words Constrain On-Line Recognition of Verbs and Nouns in French 18-Month-Olds. Language Learning and Development, 10(1), 1–18. http://doi.org/10.1080/15475441.2012.757970 Christophe, A., Dautriche, I., de Carvalho, A., & Brusini, P. (2016). Bootstrapping the Syntactic Bootstrapper. In Proceedings of the 40 th annual Boston University Conference on Language Development. Boston, MA: Cascadilla Press, 75-88. de Carvalho, A., Dautriche, I., Lin, I. & Christophe, A. (2017). Phrasal prosody constrains syntactic analysis in toddlers. Cognition, 163, 67-79. de Carvalho, A., He, A. X., Lidz, J., & Christophe, A. (2015). 18-month-olds use the relationship between prosodic and syntactic structures to constrain the meaning of novel words. 40th Boston University Conference on Language Development. Boston, MA - USA; November, 2015 Haryu, E., & Kajikawa, S. (2016). Use of bound morphemes (noun particles) in word segmentation by Japanese-learning infants. Journal of Memory and Language, 88, 18–27. http://doi.org/10.1016/j.jml.2015.11.007 Shi, R., & Melançon, A. (2010). Syntactic Categorization in French-Learning Infants. Infancy, 15(5), 517–533. http://doi.org/10.1111/j.1532-7078.2009.00022.x Waxman, S. R., Lidz, J. L., Braun, I. E., & Lavin, T. (2009). Twenty four-month-old infants’ interpretations of novel verbs and nouns in dynamic scenes. Cognitive Psychology, 59(1), 67–95. http://doi.org/10.1016/j.cogpsych.2009.02.001 Zangl, R. &, & Fernald, A. (2007). Increasing Flexibility in Children’s Online Processing of Grammatical and Nonce Determiners in Fluent Speech. Language & Learning Development, 3, 199–231. |
Search the site...
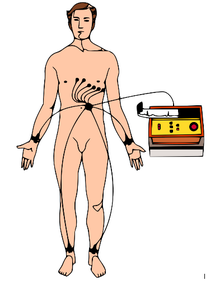
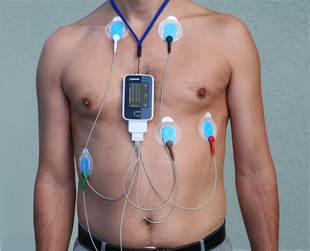
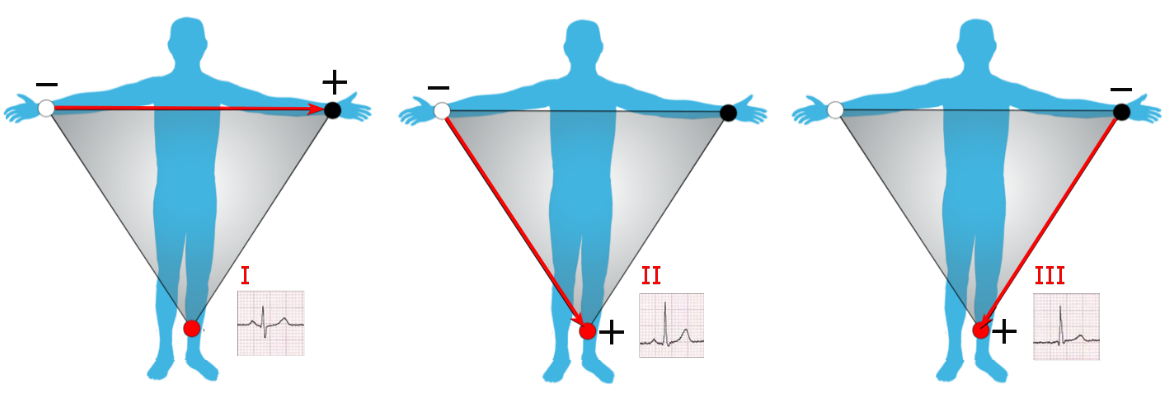
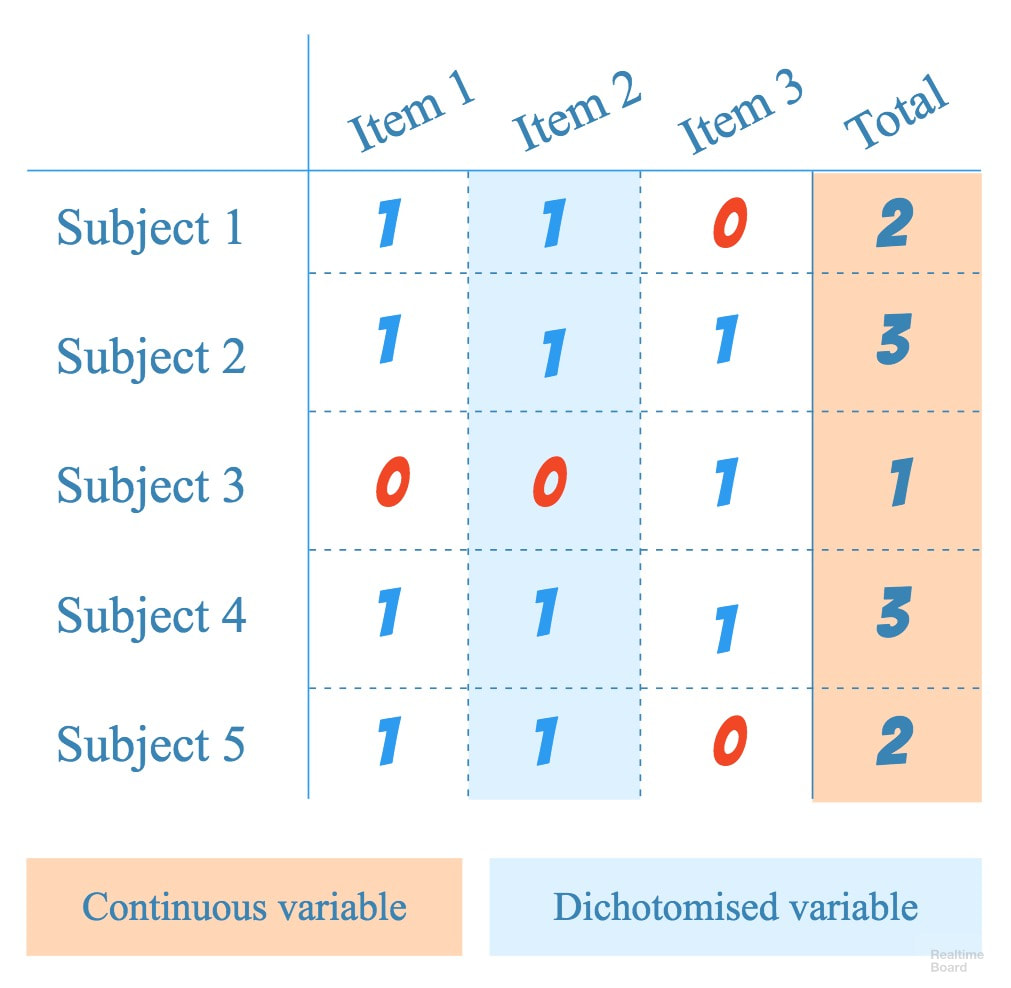
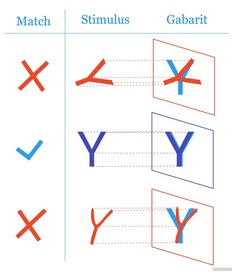
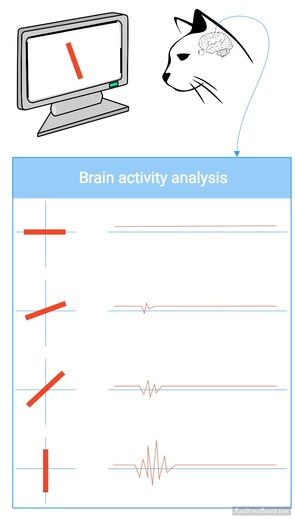
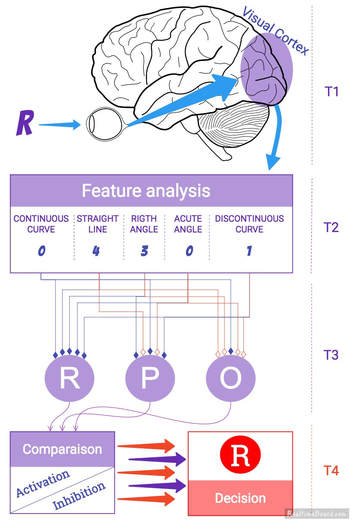
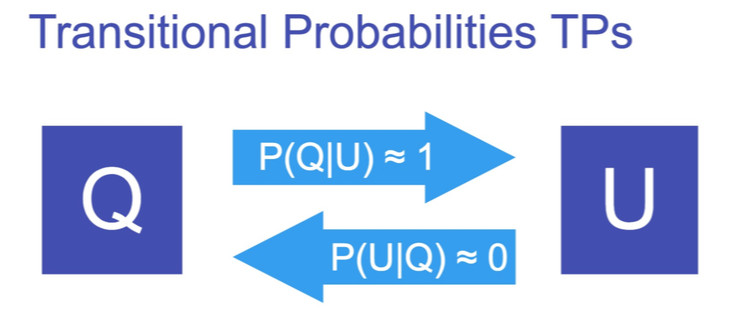
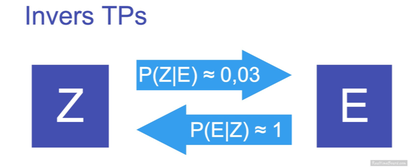
Photo used under Creative Commons from DJANDYW.COM & DJANDYW.TV AKA ANDREW WILLARD
